


Data Science
Forecasting New York City Weather Data
Data Science
Forecasting New York City Weather Data
Kaitlyn McVeigh '26 conducted this research as part of DS 480: Data Science Capstone.
Overview
Weather forecasting and prediction is an essential aspect of everyday life that often goes overlooked. This process is crucial for guiding people’s daily activities, transportation, agriculture, tourism, industry, energy management and protecting people in the wake of natural disasters. The intention of this project is to determine which machine learning model provides the most accurate temperature predictions for New York City.
Researcher

Kaitlyn McVeigh ’26
Data Science
College of Arts & Sciences
Cloudy with a Chance of Skyscrapers: Forecasting New York City Weather Data
Background & Research Goals
Background
- Weather forecasting and prediction is an essential aspect of everyday life that guides people’s daily activities, transportation, agriculture, tourism, energy management, and protecting people in the wake of nature disasters.
- In its infancy, weather forecasting and prediction was imprecise and unreliable, with irregular observations that were hardly applicable (Lynch, 2008).
- Nowadays, to predict and forecast weather trends, big data analytics and systems are used to process the large volume of data by means of high-dimensional applications that can handle complex datasets (Fathi et al., 2022).
- Machine learning models are equipped to recognize patterns and make predictions through training the models on vast datasets, improving their prediction abilities overtime.
Research Goals
- Determining which model provides the most accurate temperature predictions for my dataset will allow the weather features to be analyzed using different methodologies that provide varying results.
- Determining which features are the most impactful for accurately predicting temperature will allow us to discard other features that are not contributing to our results.
Methods
Dataset
- The dataset used for this project comes from Open Weather, an online weather service that provides extensive global past, current, and future weather forecasts (Open Weather).
- The specific dataset used contains actual historical hourly weather forecasts for New York City from 1 January 2004 – 31 December 2024, containing over 20 different features illustrating different weather measurements and conditions used to document the current weather condition.
Methods
- To identify which features are best for predicting temperature, a correlation matrix displays the relationship between features and outlines the strength of each relationship.
- Forward selection adds a feature one by one using cross validation to build a predictive model that provides the greatest improvement to the model at each step, resulting in the best features for your intended goal.
- Machine learning models that are used to analyze temperature predictions include Lasso Regression, Random Forest, and ARIMAX.
- Each of these models have their own methods of predicting outcomes so having various models provides results from multiple different avenues.
- Three accuracy metrics that will be used to determine which model overall provides the best predictions include R-squared (R2), Mean Absolute Error (MAE), and Root Mean Squared Error (RMSE).
Results
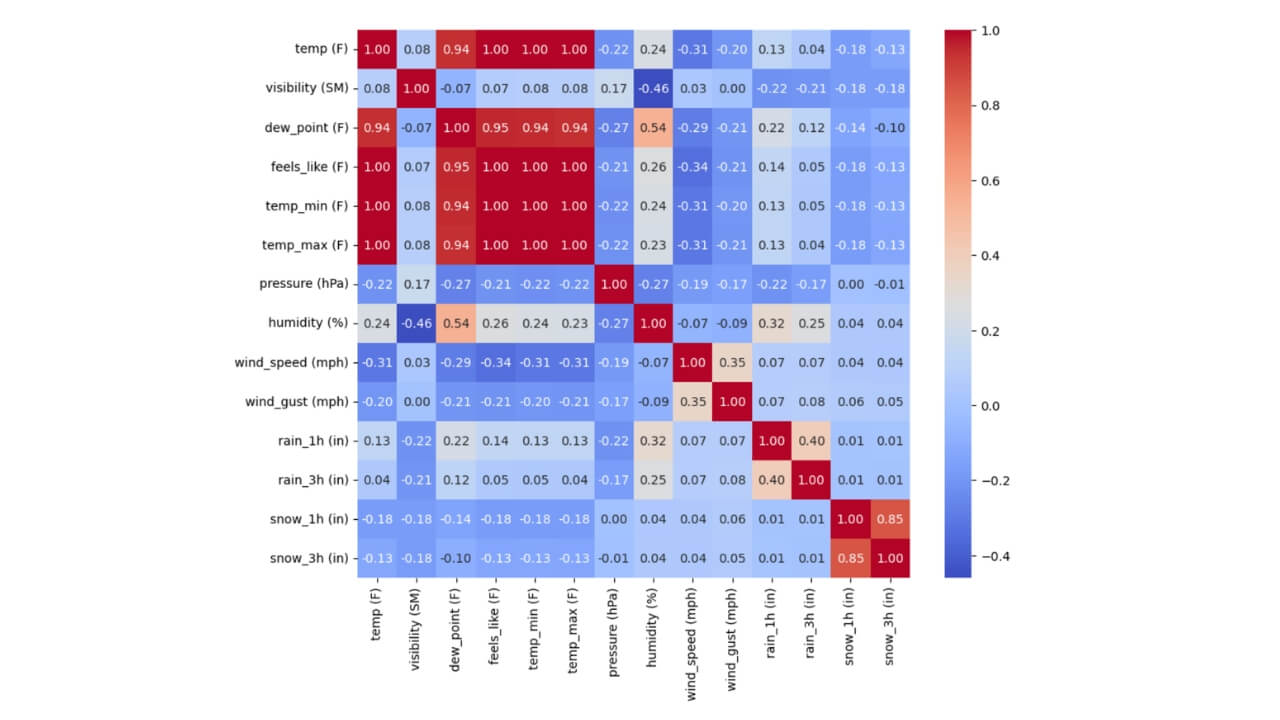
Figure 1: Heat Plot Correlation Matrix of Weather Features
-
The correlation matrix ranges from -0.5 to 1, with a value of 1 indicating a strong linear relationship and high correlation among the features.
-
The features feels_like (F), temp_min (F), and temp_max (F) all have a perfect correlation of 1 with temp (F).
| R2 | RMSE | MAE | |
| Lasso | 0.996 | 1.08 | 0.817 |
| Random Forest | 0.994 | 1.28 | 0.906 |
| ARIMAX | 0.991 | 1.62 | 1.279 |
Table 1: Model Metrics for Temperature (°F)
Results for Lasso Regression, Random Forest, and ARIMAX models using features from the forward selection.
The Lasso Regression model achieved the highest prediction measures with the highest R2 and the lowest RMSE & MAE, followed by the Random Forest model, and then the ARIMAX model.
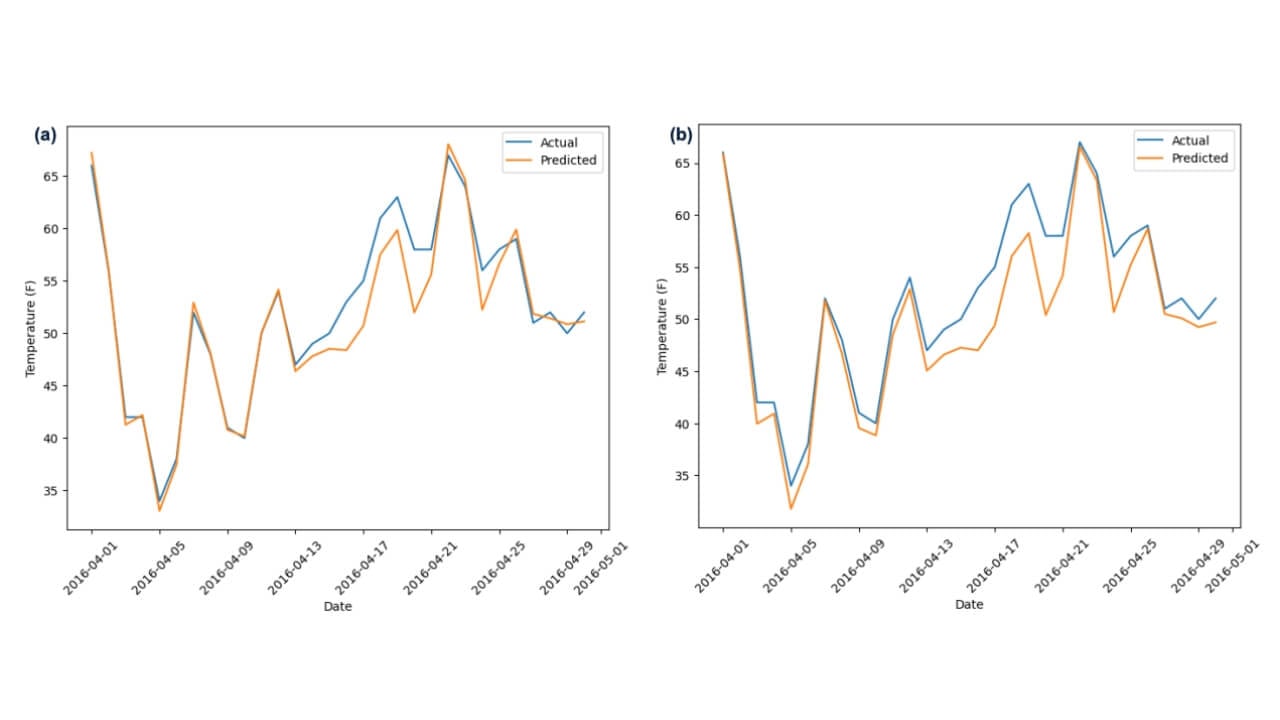
Figure 2: Time Series Plots of Temperature (°F) for April 2016 from Lasso Regression and ARIMAX
-
These graphs use the 5 features from the forward selection to make the predictions. The Lasso Regression model (a), uses L1 regularization to improve prediction outcomes whereas the ARIMAX model (b) uses ARIMA components with an addition ‘X’ endogenous variables to improve prediction outcomes.
Interpretations
- The correlation of 1 between feels_like (F), temp_min (F), temp_max (F), and temp (F) shown in the heat plot introduces severe multicollinearity, preventing the models from distinguishing the impact of the other variables in the dataset; as a result, these variables must be removed.
- Forward Selection provided the 5 strongest features that should be used to predict temperature with the best accuracy.
- An R2 of 0.996 for the Lasso Regression indicates that 99.6% of the variance associated with predicting temperature is explained by the features chosen by the forward selection. An RMSE of 1.08 indicates that the model differs from the observed observations by 1.08 degrees (°F). In terms of temperature, this indicates a highly accurate model result. An MAE of 0.817 indicates that predictions made by the model differ from the actual by 0.817 degrees (°F).
- The inflated RMSE could be a result of outlier sensitivity from the
penalization of larger errors. This may be attributed to rising temperatures over the 20-year period, particularly noted in recent years, as a result of climate change. The model may struggle to capture the impact of climate change on future years when it is trained solely on historical data that does not reflect the effects of climate change.
- The inflated RMSE could be a result of outlier sensitivity from the
- Graph (a) predictions stay closer to the actual observations and track the peaks throughout the month with higher accuracy, whereas graph (b) struggles outputting predictions that can do so.
Future Research
- Since these models can predict based on the observations in the dataset, future implications include forecasting future observations and using the data from Open Weather once recorded to compare predictions and outcomes.
- Using these models to predict other regions of the country with different climates and/or determining indicators of potential weather events or natural disasters (i.e., thunderstorms, heatwaves, hurricanes, tornadoes, etc.)
References
Fathi, M., Haghi Kashani, M., Jameii, S. M., & Mahdipour, E. (2022). Archives of Computational Methods in Engineering, vol. 29, pp. 1247-1275 Lynch, P. (2008). Journal of Computational Physics, vol. 227, pp. 3431-3444
Open Weather (2024). Open Weather Map History Bulk
Faculty Mentor
Professional Application
"This project allowed me to expand my interest in weather related-data by working with real-world data in a controlled environment. I was able to explore different avenues and experiment with different algorithms or ideas, allowing me to curate a project that illustrates my goals and future implementations. Through this project, I have learned to collect data, clean, analyze, interpret, and present my findings in a professional manner. This in turn has given me a diverse skillset that will carry over in my future career endeavors." - Kaitlyn McVeigh '26
For Further Discussion
This serves as an overview of the project and does not include the complete work. To further discuss this project, please email Kaitlyn McVeigh.
Course Overview
DS 480: Data Science Capstone serves as a culminating experience for the Data Science major. Students work on an independent project that will allow them to integrate knowledge from their previous courses in the major and apply that knowledge to a problem in a domain of their interest.
Explore Our Areas of Interest
We've sorted each of our undergraduate, graduate and doctoral programs into unique Areas of Interest. Explore these categories to discover which programs and delivery methods best align with your educational and career goals.
Explore Business and Finance at Quinnipiac
Explore Computing and Technology at Quinnipiac